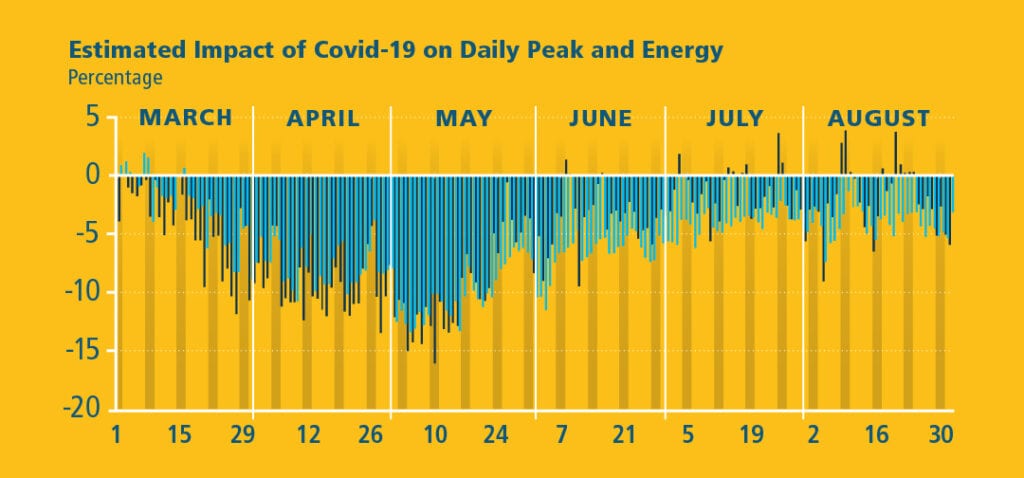
The impact of the COVID-19 pandemic on energy usage patterns in the PJM footprint has steadily lessened since May, as social restrictions have lifted and warmer weather has sparked demand for electricity.
Daily peak load is climbing back toward that of a typical year, Andrew Gledhill, Senior Analyst – Resource Adequacy Planning, said in a presentation to the Planning Committee on Sept. 1. PJM has posted an updated Near-Term Load Analysis database of estimated load impacts on its Pandemic Coordination page.
Overall energy usage, too, is recovering, but more slowly, he said.
For example, in August, overall load was down about 3.9 percent compared with 8.9 percent in April and May, which marked the height of the effect from pandemic-related behavior, Gledhill said.
For the most part, the drop in typical daily energy usage in August ranged from about 1.6 percent to 5.3 percent, not including Aug. 4-6, when much of the footprint experienced outages related to Hurricane Isaias.
Comparatively, throughout May, daily usage was down anywhere from 6.1 percent to 13.4 percent.

Isolating the Pandemic Effect
Prior to the pandemic, PJM was using a load forecast model based on a September 2019 economic forecast, Gledhill said.
Since March, PJM has worked to tease out the effect on load of COVID-19 restrictions and related changes in human behavior, primarily social distancing.
To do this, PJM has been using traditional forecast models to look back at expected loads, plugging in the actual weather conditions and noting the difference in actual peaks and energy usage from what the models would normally forecast. A negative value means the load came in lower than would have been expected pre-COVID-19 closures.
Peak Returning to Normal
Peak usage is more sensitive to the weather, Gledhill said. So as the “shoulder” months of spring gave way to the heat of summer, the maximum load served on any given day began to recover swiftly.
April and May weekday peaks came in at 10.1 percent less (about 9,100 MW) compared with a typical year. In August, that figure has been comparably small, at 1.6 percent (about 2,000 MW). The COVID-19 related impacts on peak, however, may begin to increase as fall approaches and cooling load decreases.
In mid-March, the pandemic had a greater effect on the peak load than overall energy usage. By mid-May, that trend reversed, due in large part to warmer weather and the easing of stay-at-home restrictions.
PJM served a preliminary peak load of approximately 145,372 MW on July 20, during a hot weather alert for the PJM footprint, presumed to be the highest peak of the year so far. Those numbers are subject to metering corrections and are not final.
The forecasted peak demand for this summer is around 148,000 MW. Last summer’s peak demand measured more than 151,000 MW on July 19.Find updated load forecasts each Thursday on PJM’s Pandemic Coordination Page.
Original source: PJM